


Capitalizable
Exceeding
78.1%
of total delivery, QTD
up 9.8 pts vs prev. period
Capitalizable value
Exceeding
$1.37M
attributable salary, QTD
+12.3% vs prev. period
Total comp tracked
$1.76M
across 178 engineers, QTD
100% attribution coverage
Non-capitalizable
Watch
$388K
operations & maintenance
+2.1% vs prev. period
Capitalizable share rising every quarter
From 62% → 78.1% cap rate since November
NovDecJanFebMarAprMay
CapitalizableNon-capitalizableCap % trend
Where the value goes
By work category, QTD
Capitalizable · $1.37M
New features
$862K
Improvements
$508K
Non-capitalizable · $388K
KTLO
$221K
Performance
$126K
Other
$41K
Epic
% cap
Cap. value
Multi-tenant SSO integration
100%
$168.2K
Usage-based billing engine
100%
$124.6K
Customer onboarding redesign
94%
$116.3K
API rate limiter & throttling
71%
$93.1K
Webhook event delivery system
100%
$78.8K
Employee
% cap
Cap. value
MJ
Marcus Johnson
99.1%
SD
Sophie Durand
96.9%
$12.8K
CM
Carlos Medina
94.2%
$12.6K
PS
Priya Sharma
93.1%
$12.4K
BL
Bryan Lee
89.5%
$11.9K

Capex

Turn engineering activity into finance-ready analysis.

Turn engineering activity into finance-ready analysis.

Turn engineering activity into finance-ready analysis.

Measuring the agentic workforce at fast-growing companies around the world

Measuring the agentic workforce at fast-growing companies around the world

Engineering costs, finally visible

Engineering costs, finally visible

Engineering costs, finally visible

Engineering CapEx reporting

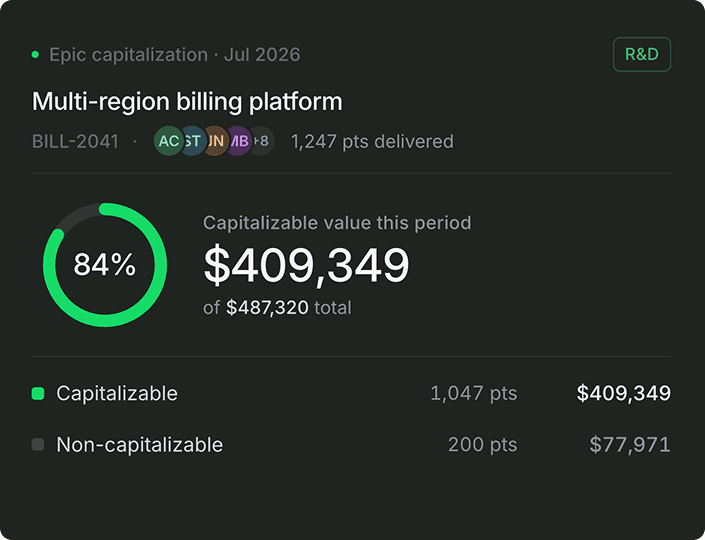
Capitalize work, automatically

Replace manual tagging and spreadsheets with continuous, evidence-based classification of capitalizable versus expensed work, whether it was delivered by an engineer, an assistant or an agent.

Capitalized vs expensed work tracking

Project-level visibility

Human and agent work classification

R&D capitalization compliance
Audit-ready, out of the box

Generate finance-ready reports backed by real artifacts, commits, PRs, tickets, delivery activity and agent output. Built for consistency and traceability.

Audit-ready reporting

Engineering evidence trails

Finance and compliance visibility

Cost attribution & allocation

Know where the money goes

See how engineering investment distributes across projects, teams, features and maintenance including what you spend on agents and AI tooling, and what it returned per unit of delivered work.

Project and initiative cost allocation

Maintenance vs innovation breakdown

Human, agent and tooling investment visibility

Finance-ready reporting
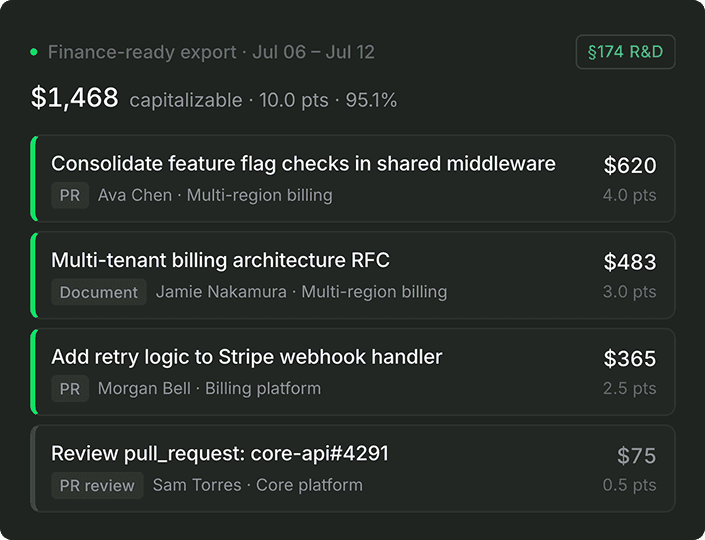
Reports CFOs actually trust

Turn delivery data into structured financial reporting, both human and agent, without asking engineering teams to change how they work.

CFO-ready reporting

Exportable finance reports

Continuous reporting visibility

"We went from 70% to 30% maintenance — it's where we want it to be."

Ignasi Vegas

Co-founder & CEO, Cubbo

"I'll pay for every AI tool you want. What I ask in return is: show me how you're going faster."

Andrew Eye

CEO & Founder, ClosedLoop

Questions finance teams ask

Questions finance teams ask

Questions finance teams ask

Does Pensero replace our CPA or tax advisor?

Does this support both GAAP capitalization and Section 174 / 174A?

How does Pensero handle domestic vs foreign engineering costs?

How quickly can we start seeing useful data?

See the product in action

See the product in action

See the product in action

See your engineering spend classified automatically

See your engineering spend classified automatically

Get a 20 minute walkthrough of the CapEx and R&E report.

Know what's working, fix what's not, and make better decisions with confidence.